Real-time graph widget UPD: new version is available
The new real-time graph widget allows filling settings Direct link to add real-time graph v2 widget
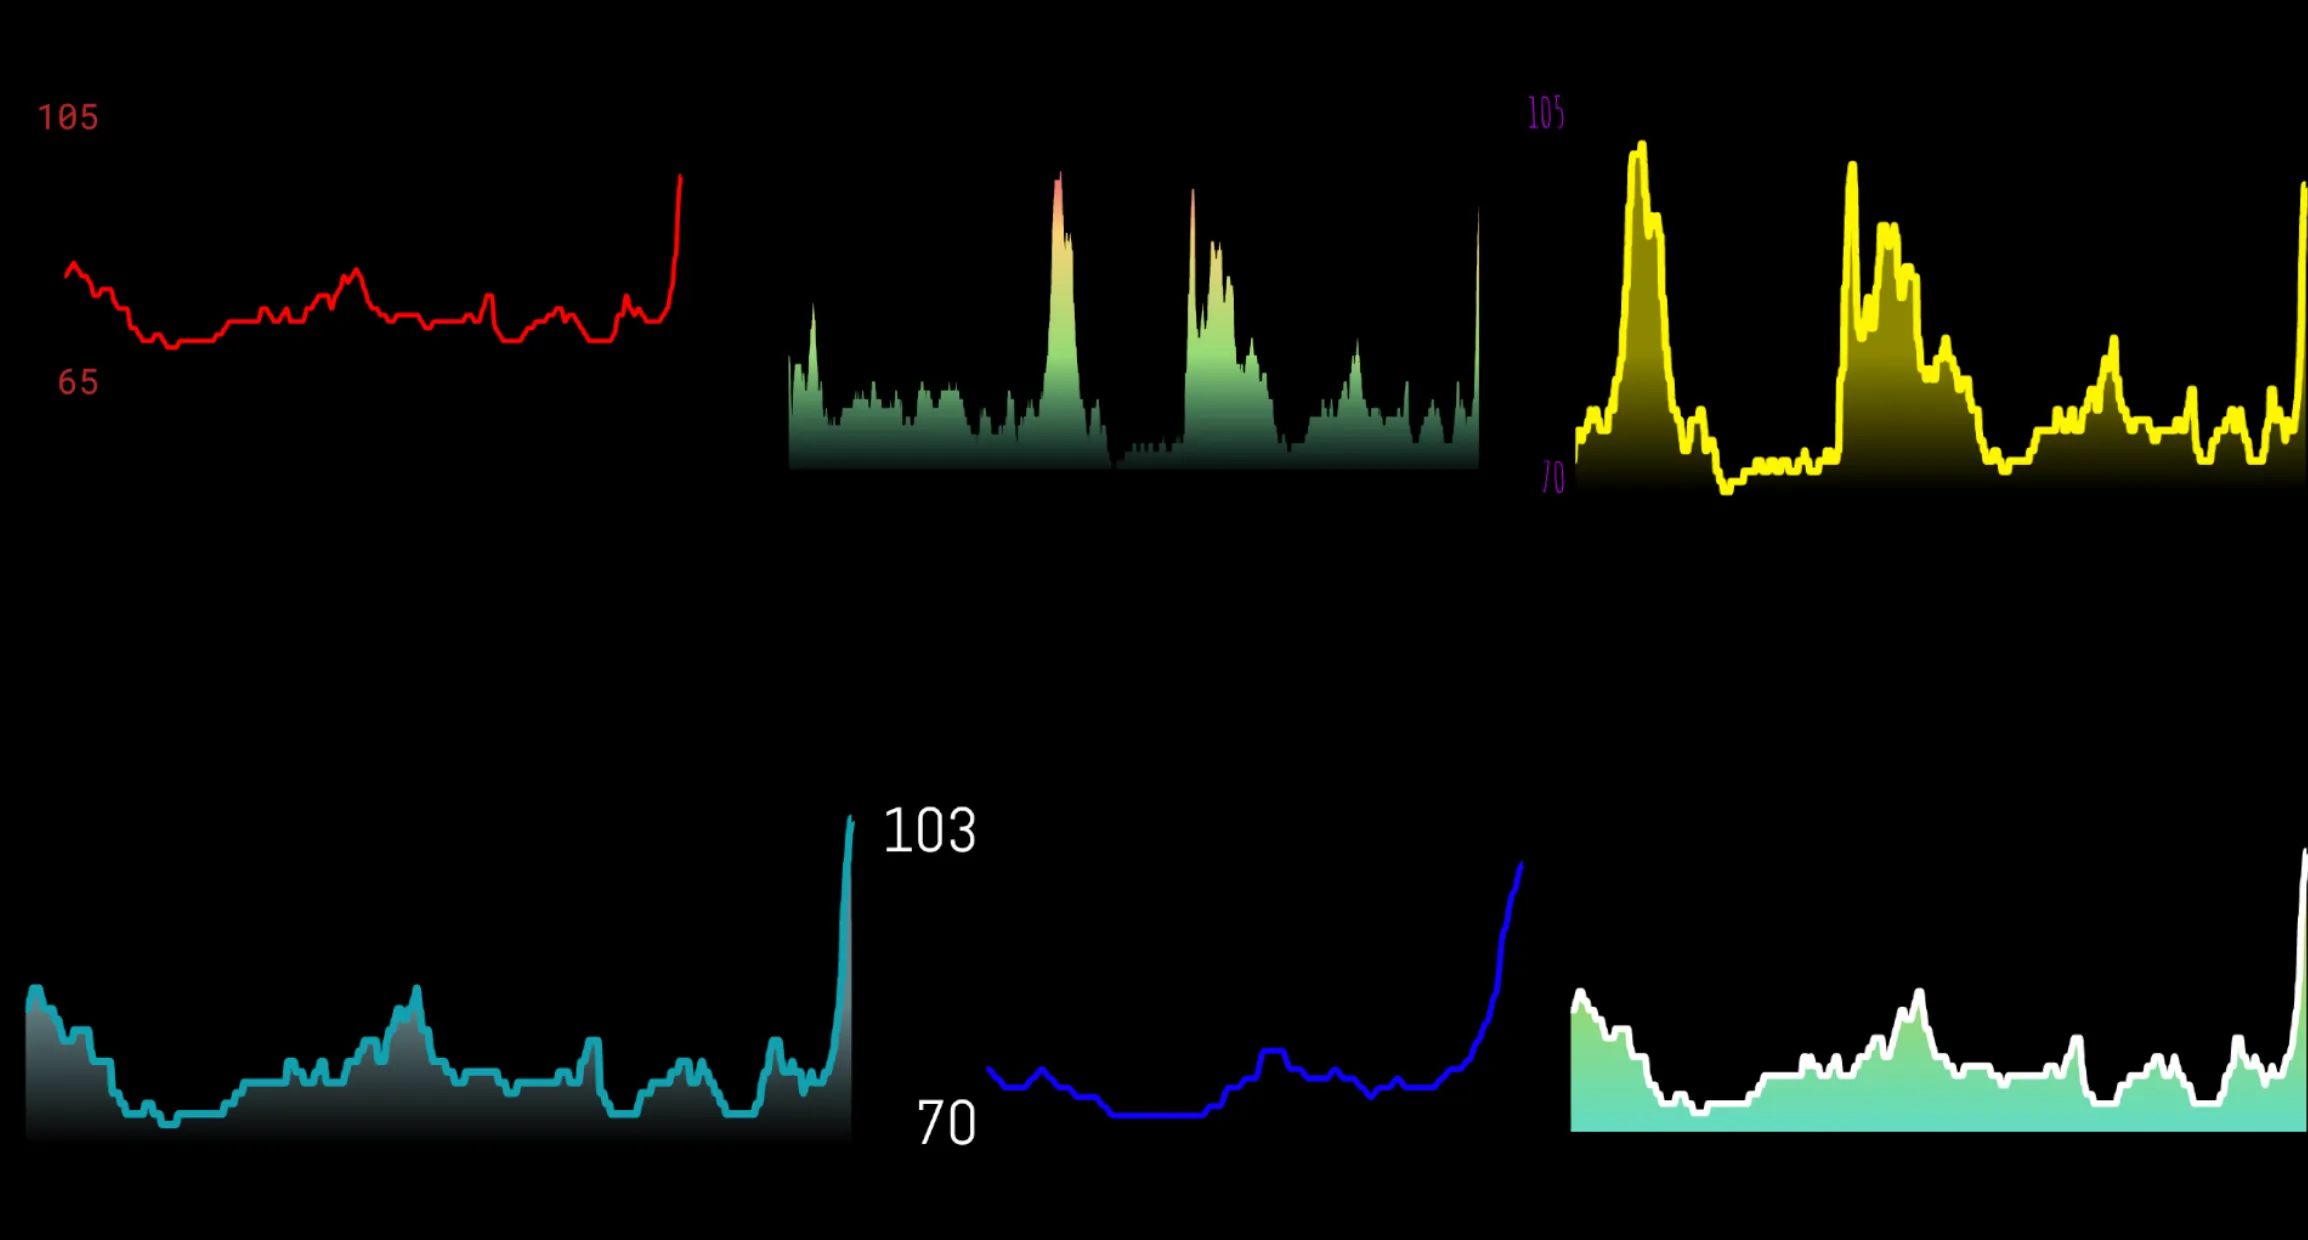
A lot of users asked for this update and finally, it’s ready. A Real-time graph widget is available for BRO plan users now.
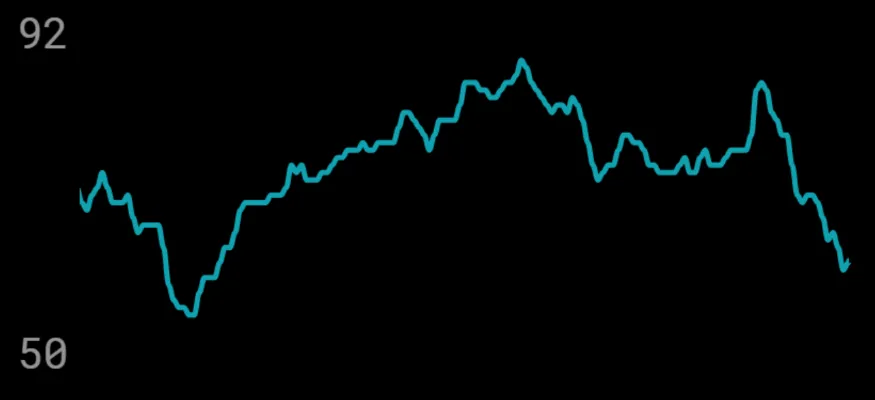
The real-time graph shows how your pulse changed for about 5 minutes. It’s dynamic! It makes widget special as well as your stream!
How to configure the Real-time graph widget:
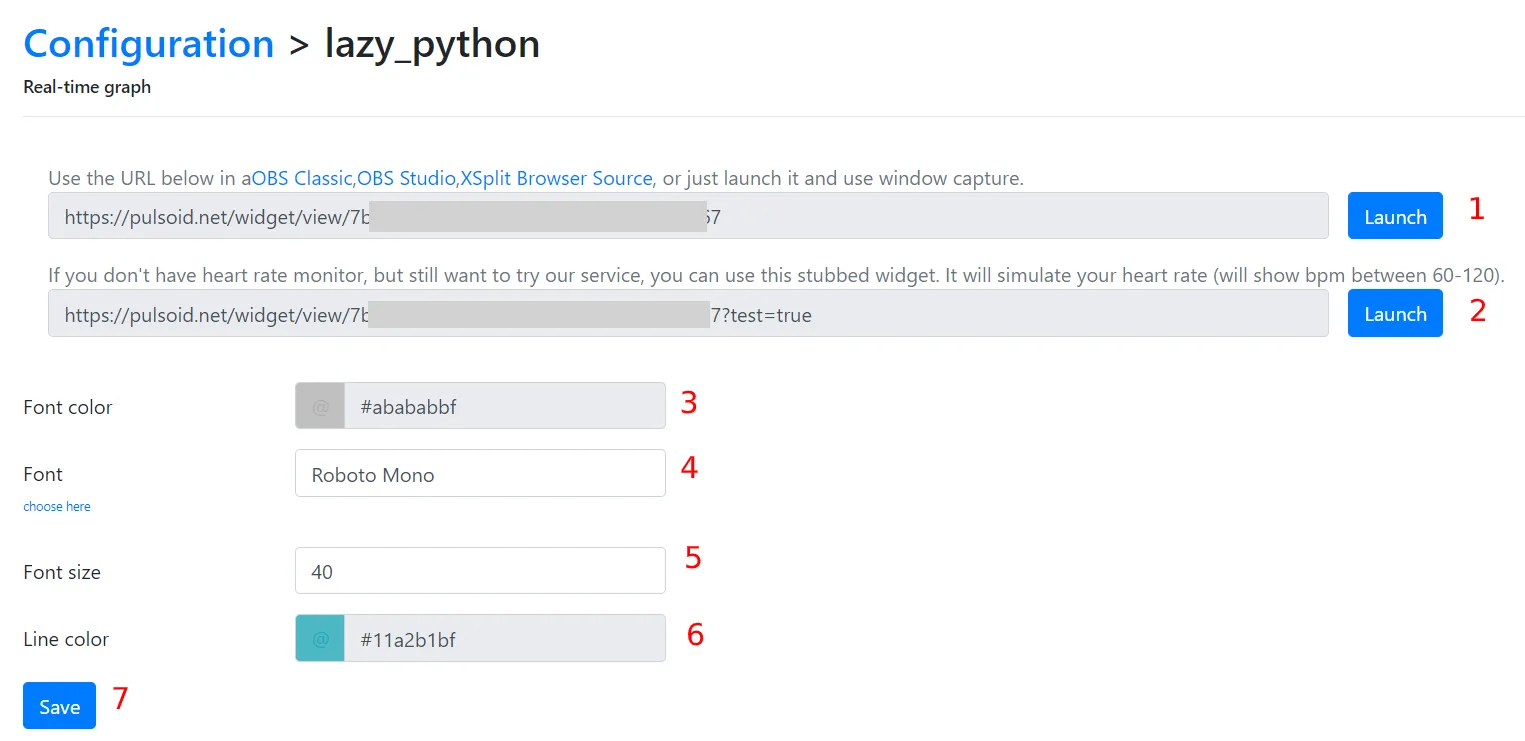
-
Use the first link when you have your heart rate monitor connected to the mobile app. Copy and Paste to your OBS(or similar)
-
Use the second link if you want to see the design with testing data (i.e. when your monitor is on it’s a way or if you still have any issues with connection)
-
Set up the color for your numbers. Transparency allowed.
-
Choose the font for your numbers. Any name from Google fonts works.
-
Choose the font size for your numbers.
-
Set up the color for the line. Transparency allowed.
-
Do not forget to ‘Save’ and refresh the Browser source in OBS to use new styles.
UPD: The new real-time graph widget allows filling settings Direct link to add real-time graph v2 widget